Bitcoin Faces Pressure: Could Drop Below Critical Support
Bitcoin struggles below $104,200, with potential declines ahead if resistance at $103,500 remains unbroken. Key support levels are under scrutiny.
Bitcoin's price struggles to maintain footing beneath $104,200, with potential for further decline if it remains under the $103,500 resistance level.
- Bitcoin has initiated a new decline, falling below the critical support at $103,500.
- The cryptocurrency is currently trading under $103,000, alongside the 100-hour Simple Moving Average.
- A significant bearish trend line is developing, with resistance positioned at $102,400 on the hourly BTC/USD chart (data sourced from Kraken).
- If it cannot overcome the $103,500 resistance area, the pair may continue its downward trajectory.
Bitcoin Price Takes a Dip
The price of Bitcoin has struggled to hold above the $104,000 support level, prompting a new decline. BTC has fallen below both the $103,500 and $102,400 thresholds, signaling a shift into a bearish trend.
This downturn saw the price even dip beneath the $101,200 support mark, hitting a low of $100,266 before consolidating its losses. A slight recovery occurred, with the price moving above the 23.6% Fibonacci retracement level from the recent decline that started at the $104,498 swing high and dropped to the $100,266 low.
At present, Bitcoin is trading below $103,000 and the 100 hourly Simple Moving Average. Should buyers attempt to rally again, they could encounter resistance near the $102,000 level, with the initial key resistance situated around $102,250. Additionally, a bearish trend line is forming, presenting resistance near $102,400 on the hourly chart for the BTC/USD pair.
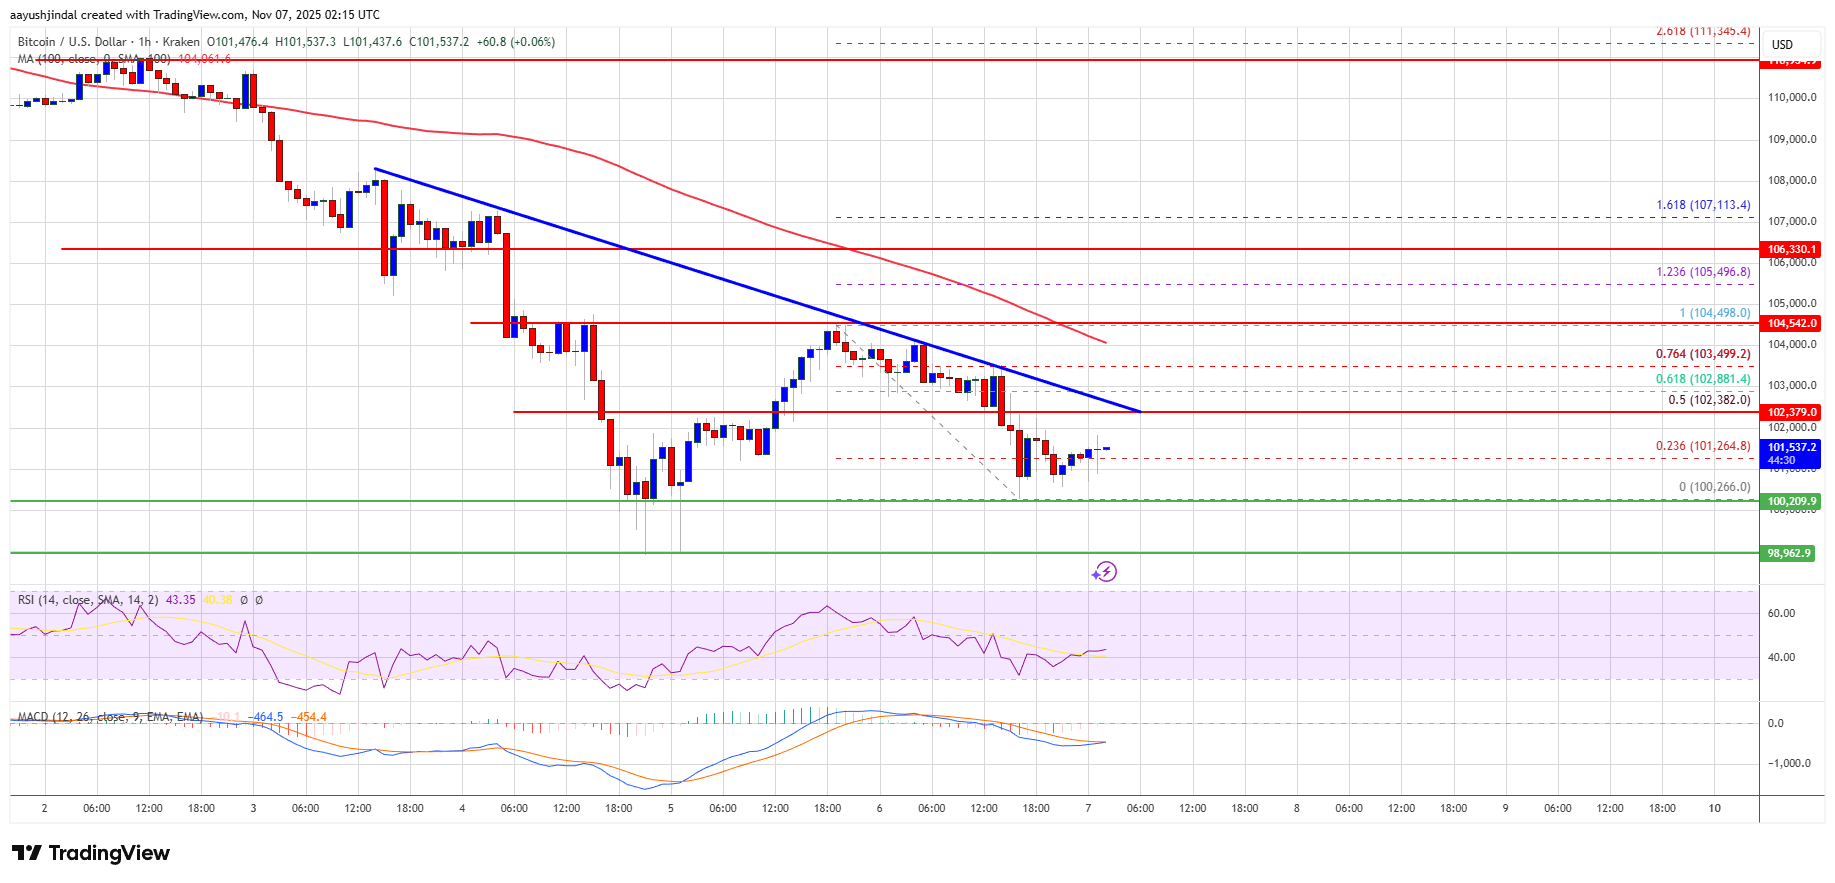
In the event of a continued rally, the next resistance levels to watch will be around $103,500 and the 76.4% Fibonacci retracement level of the recent drop from the $104,498 swing high to the $100,266 low. Should the price manage to close above the $103,500 resistance, it could pave the way for further upside, potentially testing the $104,200 resistance. If bullish momentum persists, the price could eventually rise towards the $105,500 mark, with subsequent resistance levels at $106,200 and $106,500.
Potential for Further BTC Losses
Should Bitcoin fail to break through the $102,400 resistance zone, it may continue to decline. Immediate support is located around $100,500, with the first significant support level at $100,000.
The next support area is at approximately $98,800. Should losses persist, the price could slide toward the $96,500 support level in the short term. The primary support is identified at $95,500, where BTC might face challenges in recovering if it drops below this threshold.
Technical Indicators:
Hourly MACD: The MACD is picking up speed in the bearish zone.
Hourly RSI (Relative Strength Index): The RSI for BTC/USD is currently below the 50 threshold.
Major Support Levels: $100,500, followed by $100,000.
Major Resistance Levels: $102,400 and $103,500.
Tags:
Related Posts
10 Time Management Tips for Remote Work Success
Struggling to stay productive while working from home? Discover 10 essential tips to master your time and boost efficiency in your remote work routine!
10 Simple Habits to Boost Your Work Productivity
Struggling to get things done at work? Discover 10 easy daily habits that can transform your productivity and make every workday feel rewarding.
10 Game-Changing Productivity Tips for Remote Workers
Struggling to stay focused while working from home? Discover tried-and-true strategies to boost your productivity and find your rhythm in a remote work setup.
Build Your First Responsive Website: A Beginner’s Guide
Ever dreamt of creating a stunning website? Join me in this step-by-step guide where we’ll build your first responsive site using HTML and CSS!
Revamping Employee Engagement for Remote Work in 2023
Discover fresh strategies to keep your remote team engaged and productive in 2023. Join us as we explore the latest trends and innovative approaches!
Mastering Market Trends: Your Guide for 2023
Curious about how to navigate today's market changes? Discover practical tips for analyzing trends to make smarter business decisions in 2023.