Bitcoin Price Update: Major BTC Sale Sparks Market Speculation
Bitcoin's recent price drop and Sequans' sale raise questions about the bull market's future. Can BTC recover or is a deeper correction on the horizon?
Bitcoin Price Update: Major BTC Sale Sparks Market Speculation
At present, Bitcoin (BTC/USD) is trading at approximately $102,000, reflecting a 2.45% decline over the last 24 hours. This dip follows the significant decision by Sequans Communications S.A. (NYSE: SQNS), one of the early corporate adopters of Bitcoin, to liquidate 970 BTC to reduce half of its existing debt burden.
This strategic move has left market participants pondering whether the bullish trend for Bitcoin is beginning to wane.
Sequans Reduces Debt by Selling 970 BTC
Sequans, a semiconductor company based in France that specializes in IoT technology and was an early proponent of Bitcoin, announced that it has successfully redeemed 50% of its $189 million convertible debt. This reduction brings its leverage down to $94.5 million. Following the sale, Sequans' Bitcoin holdings have decreased from 3,234 BTC to 2,264 BTC, which currently holds an estimated value of around $240 million.
With this action, the company has improved its debt-to-NAV ratio from 55% to 39%, allowing for greater flexibility in its treasury management.
Despite this sale, CEO Georges Karam emphasized Sequans' long-term commitment to Bitcoin, describing the decision as "a tactical move to fortify our financial foundations." Furthermore, the company is looking to expand its ADS buyback program, which could positively impact its Bitcoin-per-share metrics.
BTC Technical Outlook: $100K Support Level in Focus
The current price prediction for Bitcoin appears bearish, particularly after BTC has experienced a significant 8% drop from its peak of $111,000. This downturn has created a descending wedge pattern on the 4-hour chart, a formation often indicative of potential bullish reversals. The chart illustrates a decline in bearish momentum, as each sell-off has resulted in higher lows within converging trendlines.
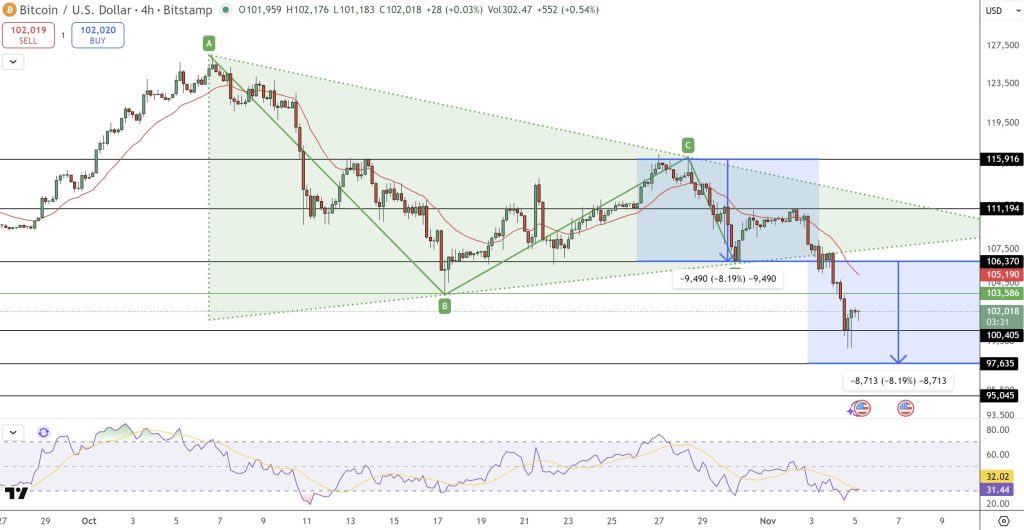
Momentum indicators are sending mixed signals at this time. The RSI currently sits at 31, which is nearing oversold conditions, while a slight bullish divergence suggests that accumulation might be underway. On the other hand, the 50-EMA ($103,500) and 200-EMA ($105,200) are capping any upward movement.
If Bitcoin can reclaim the $103,600 level, a potential short-term rebound could target $106,300, followed by $111,200, which aligns with previous resistance zones. However, if the price fails to maintain support at $100,400, it may lead to a deeper correction towards the range of $97,600 to $95,000, near the price base seen in September.
What Lies Ahead for BTC?
The trading community remains split on whether Sequans' sale is a sign of broader institutional caution or simply a short-term adjustment. From a technical perspective, Bitcoin’s wedge formation indicates the possibility of the market nearing a local bottom.
A confirmed breakout above $103,600 could pave the way for a recovery trajectory towards $115,000 and potentially $120,000, provided that trading volume supports this movement.
In the meantime, short-term sentiment continues to be fragile, yet the long-term outlook remains optimistic among many market participants.
Tags:
Related Posts
Top 5 DeFi Yield Farming Platforms You Need to Know in 2023
Curious about where to start with yield farming? Check out my deep dive into the top 5 DeFi platforms transforming the game this year!
Discover Passive Income: Staking Ethereum 2.0 Simplified
Ready to earn while you sleep? Dive into our easy guide on staking Ethereum 2.0 and unlock your potential for passive income in the crypto world!
Stay Safe: 5 Conservative Crypto Trading Strategies
Want to explore crypto without the stress? Discover 5 cautious strategies that let you invest smartly while minimizing risk. Perfect for the cautious investor!
Choosing the Right Hardware Wallet for Your Crypto Security
Unsure which hardware wallet to trust with your crypto? Discover essential tips and comparisons in our ultimate guide to secure your digital assets!
Start Your Crypto Journey: A Friendly Guide for Beginners
Thinking about investing in cryptocurrency? This beginner's guide covers everything you need to know to get started safely and confidently.
Unlocking Bitcoin's Potential: The Magic of DCA
Curious about investing in Bitcoin? Discover how dollar-cost averaging can help you navigate the crypto market with confidence and build lasting wealth.