XRP Price Surge: Will Buyers Maintain the Momentum?
XRP is on a recovery path after hitting lows. Will buyers sustain this momentum and breach key resistance levels?
XRP has kicked off a recovery phase after hitting a low of $2.050. Currently, the price has climbed back above the $2.25 mark and is eyeing a break through the $2.420 resistance level.
- The XRP price initiated a recovery above the $2.20 threshold.
- It is presently trading above $2.250 and surpassing the 100-hourly Simple Moving Average.
- On the hourly chart for the XRP/USD pair (data sourced from Kraken), a bearish trend line was breached at the $2.240 resistance level.
- If it can clear the $2.420 barrier, the pair may continue its upward trajectory.
XRP Price Recovery in Motion
After experiencing losses below the $2.25 and $2.20 levels, XRP followed a similar trend to major cryptocurrencies like Bitcoin and Ethereum. The price even dipped below $2.150 and $2.120.
A low point was reached at $2.066, after which the price began to recover. It surged back above the $2.20 and $2.25 levels, even surpassing the 50% Fibonacci retracement of the recent downward trend from the swing high of $2.552 to the low of $2.066.
Moreover, the breach of a bearish trend line at the $2.240 mark was significant on the hourly chart of the XRP/USD pair. With the price now trading over $2.250 and above the 100-hourly Simple Moving Average, any fresh upward movements might encounter resistance around the $2.40 area.
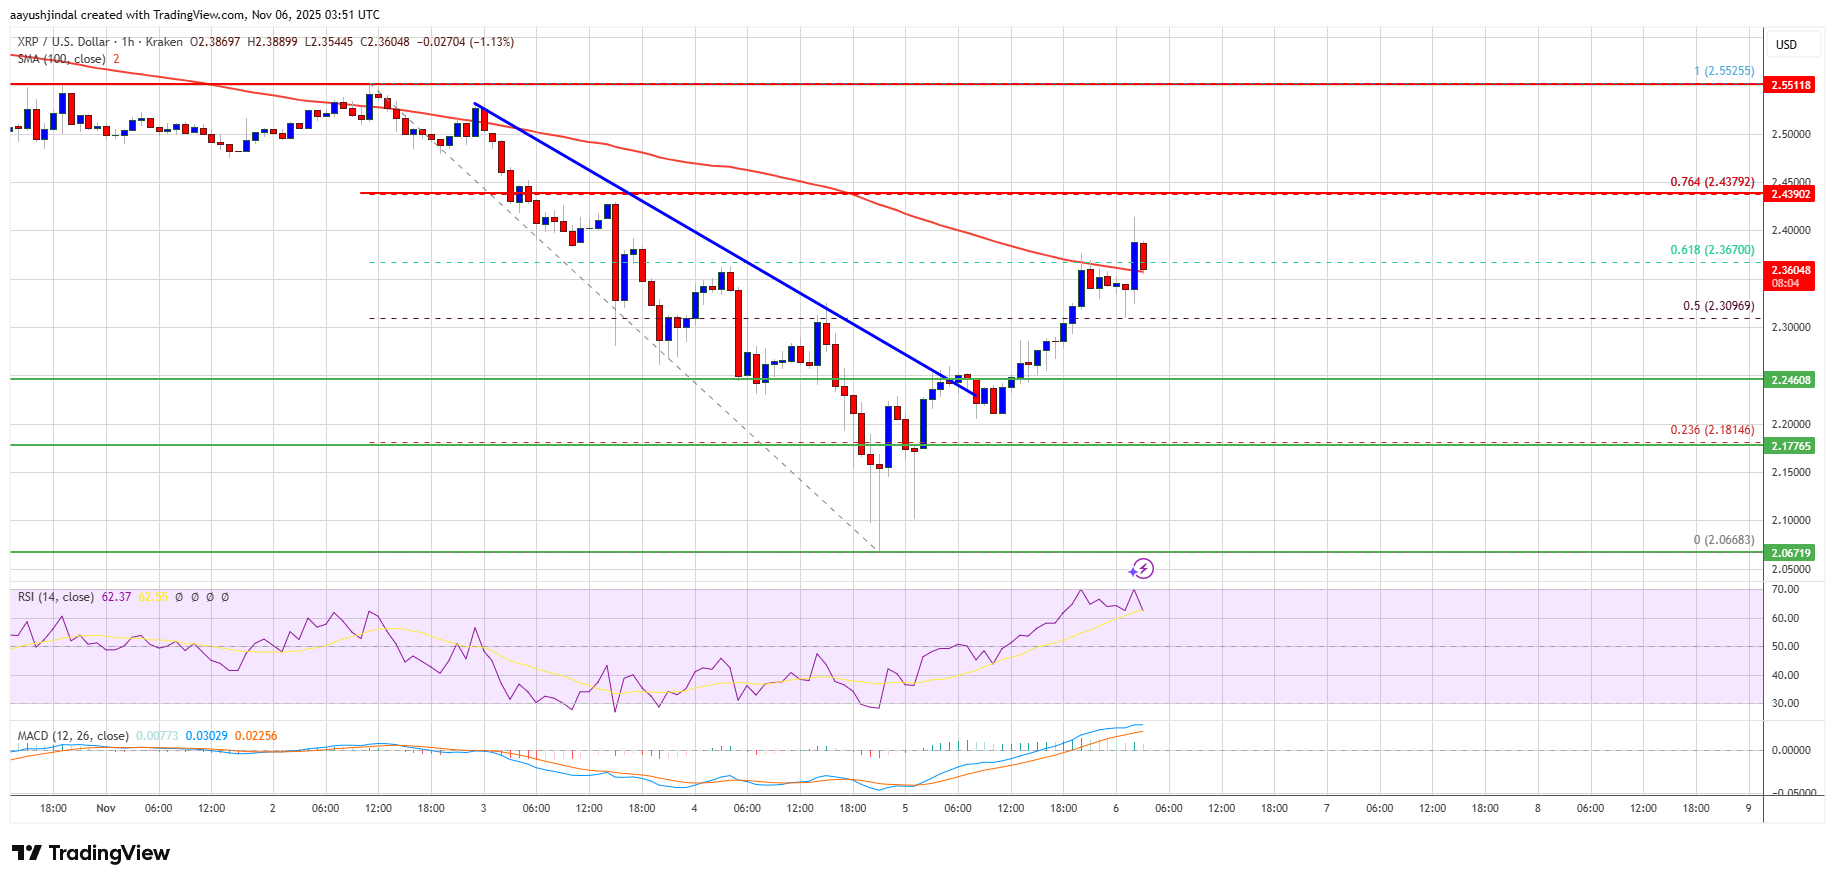
The primary resistance level to watch is around $2.420, which coincides with the 76.4% Fibonacci retracement level from the downward move between the swing high of $2.552 and the low of $2.066. If XRP manages to break through this level, it could push the price towards $2.480. A decisive movement past $2.480 could propel XRP towards the next resistance at $2.550, with further gains potentially reaching $2.650. The next significant challenge for the bulls might emerge around the $2.720 region.
What If Another Decline Occurs?
Should XRP struggle to break through the $2.420 resistance zone, it might trigger a new decline. The first point of support to monitor on the downside is near the $2.280 level, with the next major support situated around $2.250.
A breakdown and closing below the $2.250 level could lead the price to continue its descent towards $2.20. If this level fails to hold, the next substantial support level lies around $2.120, below which the price may decline further towards $2.060.
Technical Indicators Analysis
Hourly MACD – The MACD indicator for XRP/USD is currently losing momentum in the bearish territory.
Hourly RSI (Relative Strength Index) – The RSI for XRP/USD has moved above the 50 mark, indicating a potential bullish trend.
Key Support Levels – $2.280 and $2.250.
Key Resistance Levels – $2.40 and $2.420.
Tags:
Related Posts
10 Game-Changing Productivity Tips for Remote Workers
Struggling to stay focused while working from home? Discover tried-and-true strategies to boost your productivity and find your rhythm in a remote work setup.
Build Your First Responsive Website: A Beginner’s Guide
Ever dreamt of creating a stunning website? Join me in this step-by-step guide where we’ll build your first responsive site using HTML and CSS!
Revamping Employee Engagement for Remote Work in 2023
Discover fresh strategies to keep your remote team engaged and productive in 2023. Join us as we explore the latest trends and innovative approaches!
Mastering Market Trends: Your Guide for 2023
Curious about how to navigate today's market changes? Discover practical tips for analyzing trends to make smarter business decisions in 2023.
10 Essential Tips to Supercharge Your Remote Work Productivity
Struggling to stay focused while working from home? Discover 10 proven techniques that can help transform your productivity and make remote work a breeze!
Unlocking 2023: The Data-Driven Marketing Trends You Need
Curious about how data can boost your marketing game? Discover the top trends for 2023 that can reshape your strategy and better connect with consumers.